5 years on Twitter – infographic

Apparently I joined Twitter five years ago today, on Nov 14, 2007. It’s been a fascinating development and back then I couldn’t envision how important Twitter would grow and how many followers I could gain in these years. In fact, 8 months earlier, in March 2007, I mentioned Twitter for the first time on this blog and my first impressions were all but positive. Here is my first comment about Twitter:

“I’m clearly totally out of fashion when I say that I have no desire to try out the new mega hype Twitter.”

At least, I have no problem admitting I was wrong. Today, Twitter is one of my most important news sources and tools for building relationships online. That said, here is a short infographic of my first five years on Twitter, courtesy of Visual.ly and Amstel Beer (!). Click on the image for a larger version.

5-years-on-twitter-infographic

Footnote: The detailed data for the infographic probably is only for the last 12 monts, so there is a possibility that other tweets and dates have generated more engagement. I am @kullin on Twitter, by the way.

The dramatic growth of Instagram – reaches 5 billion twice as fast as Flickr

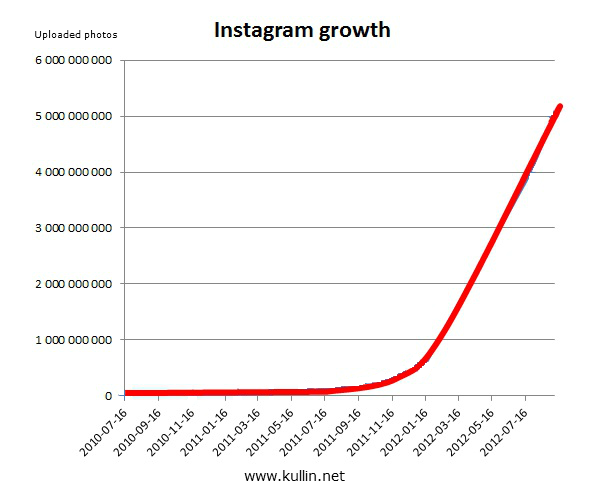
In just a little more than two years, Instagram has gone from zero to 5 billion shared photos. The popular photo sharing app announced yesterday that it had surpassed 80 million users and 5 billion photos uploaded by its users. As a comparison, it took Flickr 4 years and 7 months to reach 5 billion photos. Instagram has reached that milestone in less than half that time.

Growth in recent months has been fuelled by the release of an Android app, which went live in April 2012.

“The combination of Android and network effects as more people use Instagram mean that we’re able to grow faster now more than ever,” Instagram creator Kevin Systrom told VentureBeat in July.

To illustrate just how fast Instagram has been growing, I made the graph below based on photo ID numbers (up to 550m, when Instagram changed how photos were identified) and official statements (4bn and 5bn).

instagram growth chart sept 2012

If you want a graph with the individual data points, click here instead.

Here are the sources for each of the data points in the graph.

http://statigr.am/viewer.php#/detail/2_3
http://statigr.am/viewer.php#/detail/5000001_581545
http://statigr.am/viewer.php#/detail/25000002_1678383
http://statigr.am/viewer.php#/detail/50000000_3090267
http://statigr.am/viewer.php#/detail/100000000_2214655
http://statigr.am/viewer.php#/detail/200000000_2273481
http://statigr.am/viewer.php#/detail/300000001_8967334
http://statigr.am/viewer.php#/detail/400000000_3849764
http://statigr.am/viewer.php#/detail/500000000_733659
http://statigr.am/viewer.php#/detail/525000000_2446096
http://statigr.am/viewer.php#/detail/550000001_5785171
http://blog.instagram.com/post/28067043504/the-instagram-community-hits-80-million-users
http://blog.instagram.com/post/30996220545/instagram-and-facebook-looking-ahead-this-is-an

For a similar graph of Flickr’s growth from zero to 5 billion photos, see this blog post.

Note: I am @kullin on Instagram if you’d like to follow me.

Instagram now growing faster than Flickr

Three days ago I took a look at how many new photos users added on Instagram each day. By looking at the ID numbers of the photos I calculated that Instagram had now reached beyond 500 million photos and that about 4.5 million new photos were uploaded per day. Then I found a blog post from Instagram that summarized last year and in the post it says that at the end of 2011, 400 million photos had been shared in total on Instagram. This confirms that my calculations were pretty accurate (the 400 millionth photo was uploaded on Dec 7, 2011).

If we look at the volume of photos during January 2012, users added approximately 4.5 million photos each day to Instagram. This seems to be confirmed by the statistics from Instagram, that says that the average number of photos uploaded per second at the end of 2011 is 60, or about 5.2 million per day.

Steady growth for Flickr
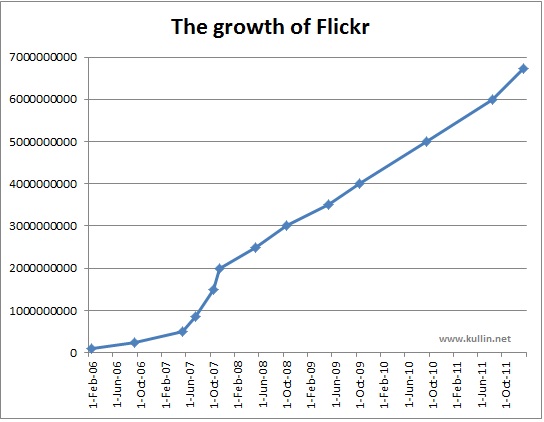
Now, if we look at the growth of Flickr, it seems that it continues to grow at about the same speed as it has been doing for the last couple of years. Official figures from Yahoo claim that users upload about 4.5 million photos per day to Flickr. But in reality, I believe it is slightly lower than 4.5 million. The 6 billionth photo was uploaded on August 1, 2011. Today, there are 6.7 billion photos on Flickr, which means that on average during the last 5 and a half months, users have uploaded 4.2 million photos per day to Flickr (724 million photos in 172 days).

In other words, Instagram is now growing faster than Flickr. Between 4.5 and 5.2 million per day for Instagram, compared to 4.2-4.5 on Flickr.

Here are two graphs describing the development and you can follow the links below for more stats and links to different milestones.

Pin It

instagram-1-billion-photos

Instagram may reach 1 billion photos in April

flickr-growth-2006-2012

Steady growth for Flickr as it reaches 6 billion photos

Instagram may reach 1 billion photos in April

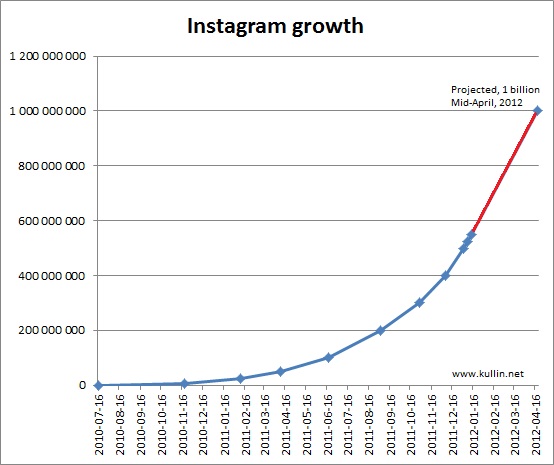
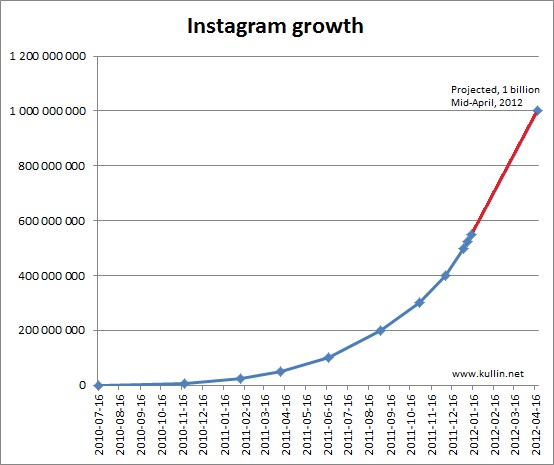
Instagram, one of my favourite apps, is growing like crazy. In September last year, I noted that users had uploaded 200 million photos, which meant that the growth rate in August was about 50 million photos per month. Now, it seems that users are adding the same number in just 11 days.

According to my calculations, Instagram passed 500 million photos on Jan 2, 2012 and 550 million on Jan 13. That means that 4.5 million photos are uploaded each day to Instagram and at that speed 1 billion photos will be reached about April 20, or possibly sooner if the service continues to add new users.

If you want to check the dates of the different milestone photos used in the graph above, follow the links below:

07-16-2010: 2

11-19.2010: 5000001

02-09-2011: 25000002

04-09-2011: 50000000

19-06-2011: 100000000

02-09-2011: 200000000

29-10-2011: 300000001

07-12-2011: 400000000

02-01-2012: 500000000

08-01-2012: 525000000

13-01-2012: 550000000

Some even numbers are not available, I suspect because they are private (or have been deleted). The ID’s of the milestones have been recovered by using Statigram and Ink360.com. There’s no guarantee that the ID numbers from theses sites are an accurate reflection of the total volume, but previously this way of counting has proven to be quite accurate.

Footnote: I’m @kullin on Instagram.

Optimizing press release content for social sharing pays off

The concept of social media releases and social media newsrooms is not new. By adding photos, videos and audio and easy sharing functionality, the chances that the content is spread across different social media channels increase. At least, that’s what we have been arguing for several years. Now there is also a study that confirms this notion.

PR Newswire and Crowd Factory looked at tens of thousands of press releases, to analyze where, when and how news releases were shared across Facebook, Twitter and LinkedIn. The findings are really interesting and I include the key conclusions from the analysis below:

1. Each press release share generates 2 new views; expands total audience by 70%.

Creating shareable content and enabling sharing capabilities through the relevant channels can dramatically increase the number of views for releases. PR Newswire and Crowd Factory found that each share generates an average of nearly 2 click-backs to the original press release.  Additionally, sharing of press releases across social networks increases the total audience, or social reach, for this content by nearly 70 percent.

2. Press releases are shared more on Facebook, but Twitter sharing drives more traffic.

Among the three largest U.S. social networks, Facebook is tops when it comes to sharing of press releases: 48 percent of press release sharing happens on Facebook, 37 percent of sharing happens on Twitter and 15 percent happens on LinkedIn.

But not all shares are created equal: in spite of Facebook’s greater popularity for sharing, each share on Twitter actually drives about 30 percent more press release views than a share on Facebook.

3. Multimedia press releases generate 3.5 times more engagement than text-only releases.

Not surprisingly, multimedia press releases that include photos, videos or audio generate more views, shares and clicks than text-only press releases. Adding a photo to a press release increases engagement by 14 percent; adding a video and a photo actually doubles the engagement rate. Press releases that contain photos, video and audio generate the most engagement, with 3.5 times more engagement than text-only releases.
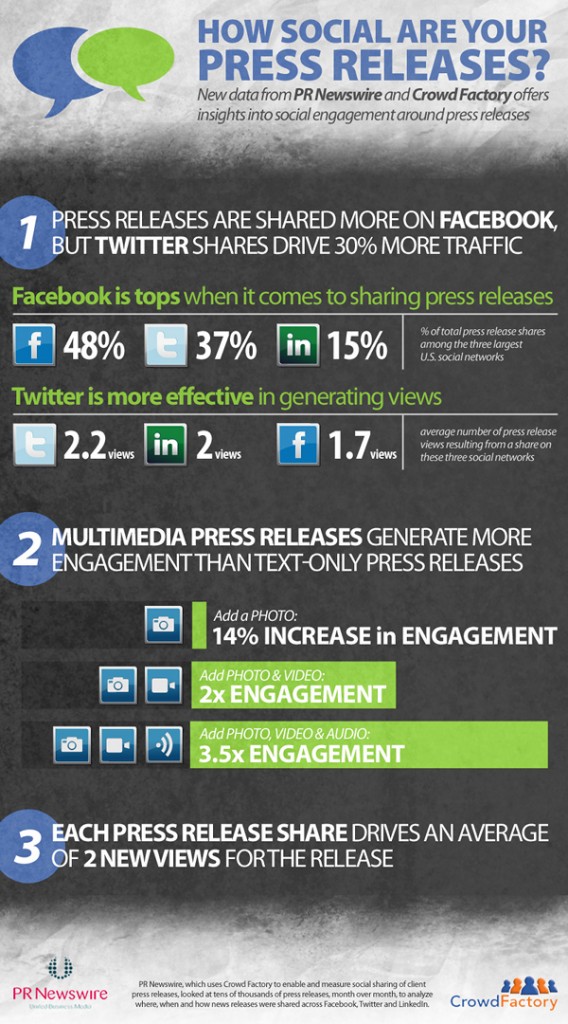
infographic social media releases - sharing on Facebook, Twitter and Linkedin

55 fascinating statistics about social media in Sweden

Sweden is ranked first of 138 countries in its use of computing and communications technology, according to an annual study from the World Economic Forum. So perhaps it’s no surprise that Swedes are quick to adopt social media and for example the Swedish blogosphere has been very lively for several years with top blogs that attract as many as one million visits per week.

In order to give you a better view of the Swedish social media landscape, I have compiled a presentation with 55 fascinating statistics. Enjoy!